„Cool looking“ charts
During my ongoing literature review I often discover interesting facts about things I’ve never thought about. Sometimes I can connect these facts with my own observations: The result is mostly a completely new idea why things are as they are. Maybe these ideas are new to you, too. Therefore I’ll share my new science based knowledge with you!
This week: This time, it’s not about a paper I’ve read. Instead, I’ll share with you my charts which were created during some short training sessions with Adobe Illustrator.
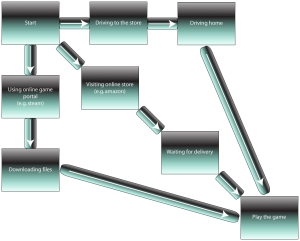
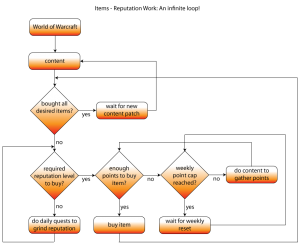
The first one gives a short overview about different distribution channels of computer games. The second chart illustrates how the retention mechanism (mentioned in last weeks „finding of the week„) of buying reputation based items can keep players active.
This „finding of the week“ is all about (cool looking) charts.

